Introducing TinyDB
20 Jun 2023TinyDB is an application I have been developing in various forms for a long time now, that I am finally able to start showing off and announcing plans for public availability. This month at Scala Days Seattle 2023 I was pleased to be able to demo the application and present about how the development using Scala.js was going along. Due to the focus of the talk being primarily about the tech used, and how useful it has been to me, I would like to take some time to actually kick-start the marketing hype cycle for this small project and let it be further known.
What is TinyDB?
TinyDB is a browser-based database application that is as easy to use as a spreadsheet. You do not need to worry about preconfiguring data schemas or types to get started, so you can use it as a basic, text-based data entry program without any configuration. With TinyDB, I hope to allow you to opt into the level of control that you need over your data, while doing so in a way that is portable and easy-to-use from any device, whether it’s your desktop computer, laptop, tablet, phone, or any other device with a modern web browser.
Some (super unfinished) images
To give you a quick idea of what this thing will be capable of at a glance, I’ve taken some development screenshots. Unfortunately I have not put a lot of effort into the CSS, so it’s a bit ugly right now but I will produce more videos and blog entries as this gets developed.
Table Display
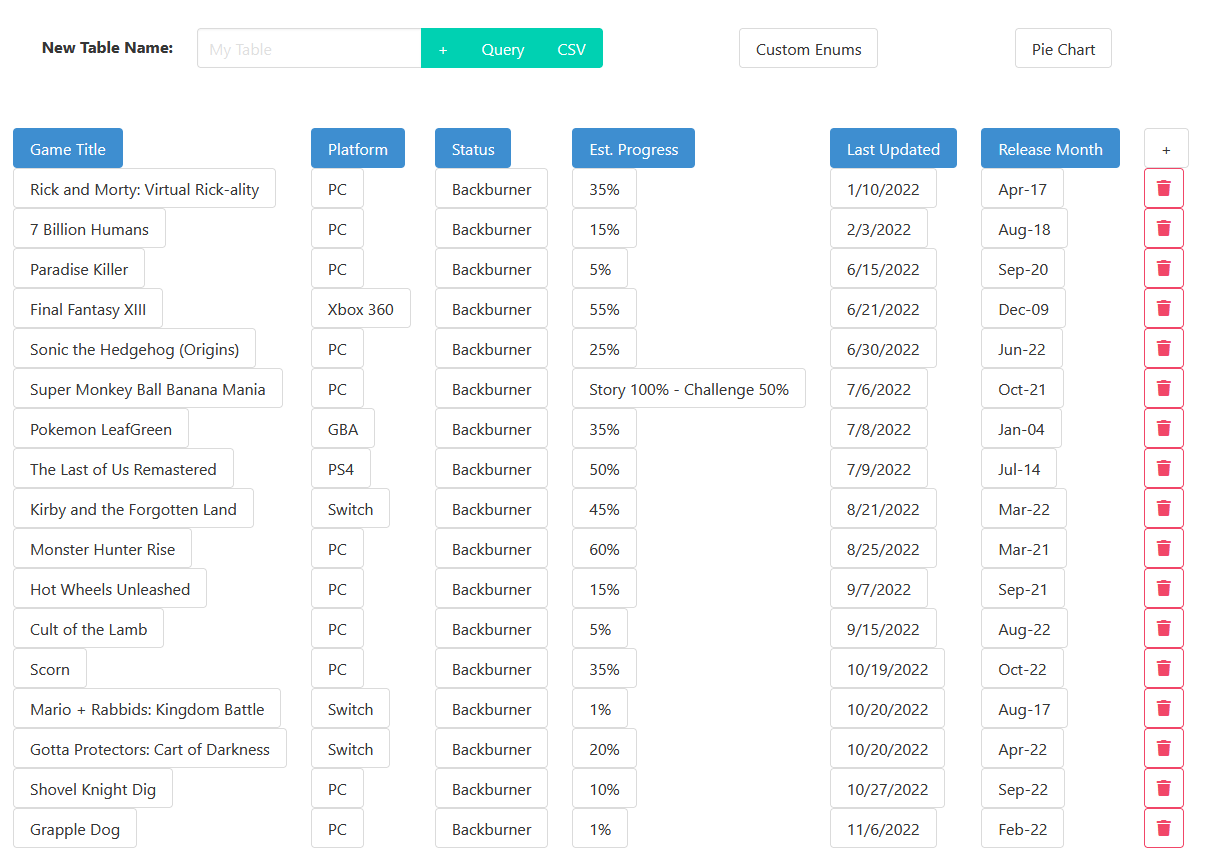 Each table is a grid of buttons that, when clicked, lets you edit its contents much like a spreadsheet cell.
You can edit column information by clicking the column, including the type of column, custom formatting, allowed data values, title, and so on.
Each table is a grid of buttons that, when clicked, lets you edit its contents much like a spreadsheet cell.
You can edit column information by clicking the column, including the type of column, custom formatting, allowed data values, title, and so on.
Custom Enumerations
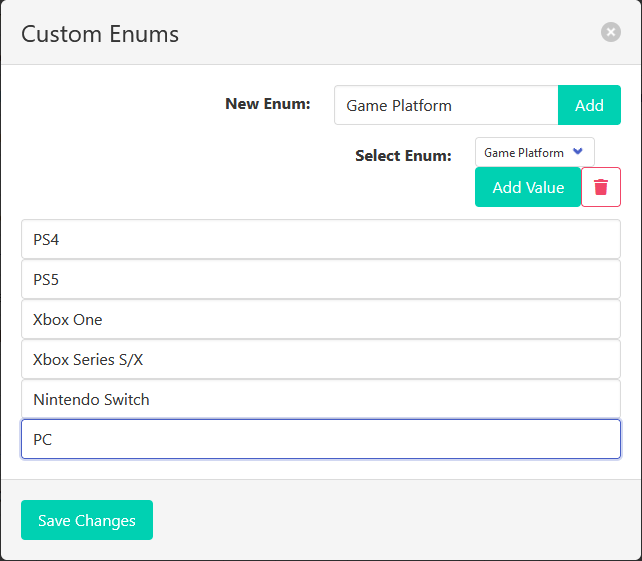 You can set columns to use custom enumerations of values, which let you ensure that invalid values are impossible.
This example shows configuring an enumeration type for video game platforms, i.e. PlayStation and PC.
You can set columns to use custom enumerations of values, which let you ensure that invalid values are impossible.
This example shows configuring an enumeration type for video game platforms, i.e. PlayStation and PC.
Queries
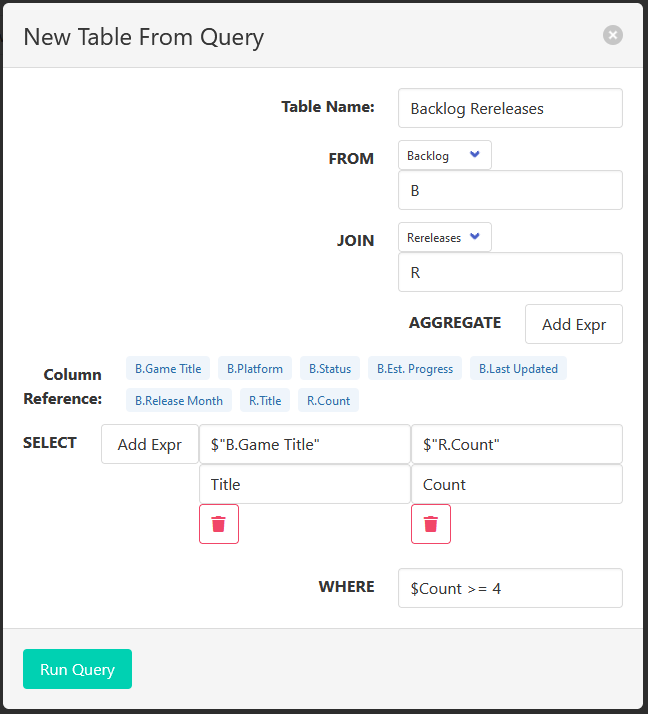 This is a very-in-progress dialog window for constructing a query.
You are able to select a host table in the FROM section, JOIN it to another table, aggregate, group by columns (UI not implemented yet), select values based on a custom expression language, and filter your queries just like you would using SQL.
This is a very-in-progress dialog window for constructing a query.
You are able to select a host table in the FROM section, JOIN it to another table, aggregate, group by columns (UI not implemented yet), select values based on a custom expression language, and filter your queries just like you would using SQL.
Charts
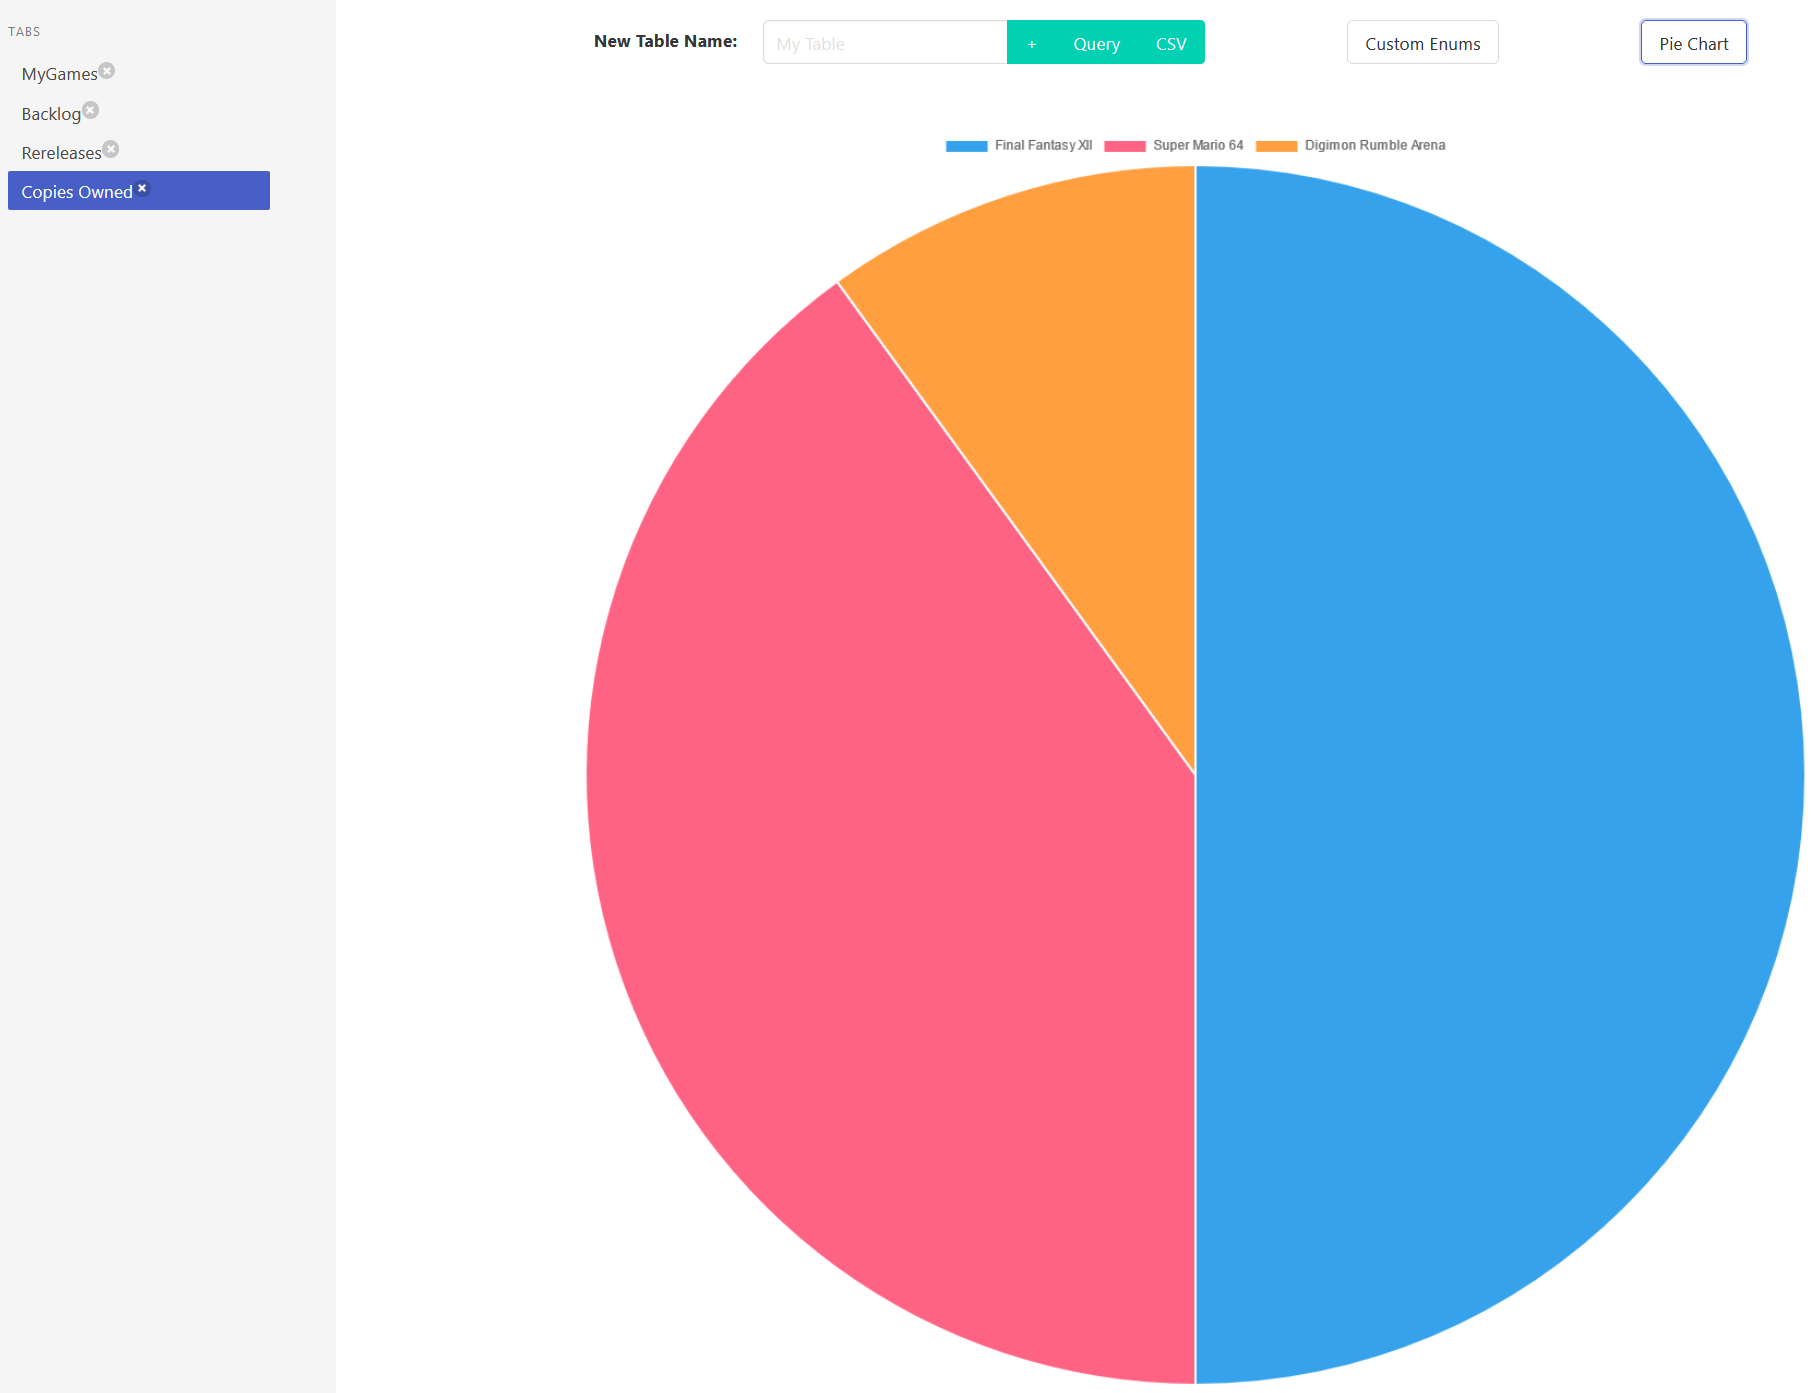 This is an example chart showing the ability to turn any table you generate into a visualization.
You are able to select which columns represent which axes or data inputs.
For this example, I have a pie chart showing the number of copies I own of three video games.
This is an example chart showing the ability to turn any table you generate into a visualization.
You are able to select which columns represent which axes or data inputs.
For this example, I have a pie chart showing the number of copies I own of three video games.
What can TinyDB do?
TinyDB can do all of the typical tasks you would associate with either a spreadsheet or a database. For those familiar with relational SQL databases, this includes:
- Queries with a basic expression language
- Aggregations & grouping
- Table joins
This will also support a number of features designed to make it easy to control your data, including:
- Custom formatting options for columns
- Enumeration support (fixed sets of “valid values” you select in a drop-down box, i.e. “days of the week”)
- CSV data import
- Custom column rules
Visually, TinyDB resembles a spreadsheet, so you should be able to do things that a spreadsheet will let you do. While it is not as freeform as, say, Excel, TinyDB will support reactive programming much the same way as a spreadsheet, by enabling you to compute the values of both columns and entire tables through reactive queries. This will allow you to have tables where, say, column “D” is the sum of the values in columns “A” + “B” + “C”. It will also allow you to aggregate and produce results from tables that frequently change. For example, lets say you have a table with all of your monthly expenses in it. You can have a “reactive query” that represents an aggregation of that table, and every time you add a new expense it will sum it up into the total for you to see.
TinyDB will also support various kinds of charts with customization options for the kind of chart, how you source its data, and how it should be displayed.
In a future release I plan on supporting more features that I am presently laying the groundwork for, including:
- Trigger functions (actions to execute whenever a row is inserted into a table)
- JavaScript-based “hooks” for your own custom logic
- More types of charts
- Grid-like interface for seeing multiple tables, queries, and charts at once
- Toggleable “foreign keys” to help with relational data entry
- Custom data entry interface support
- …And more!!!
Example use case & a brief history
Starting back around 2017, I wished to create something to help manage my multimedia backlog – games, movies, books, TV shows, you name it – while also approaching the complexity of something like IMDB, TMDB, or TheTVDB.
This proved to be quite an investment, and not something I was able to commit myself to for a long time without burnout.
I decided to try using an Excel spreadsheet instead, which, for the most part, worked fairly well. I was able to organize my media in as many tables as I wanted, with the columns and data types that made sense to me, and creating something that I could edit from my desktop as well as my phone or tablet. Unfortunately, I ran into a serious snag, and that was that I expected to be able to join tables together in my browser. Neither Excel nor Google Sheets really support that feature for the web-based spreadsheets they offer, or the features they did offer were otherwise inadequate for my needs. I wanted to be able to define multiple tables that I could cross-reference and combine with each other in interesting ways to categorize and calculate statistics about my backlogs, and this simply was not possible with Excel.
Lets say that I would like to keep track of how many games I own, per-year, per-gaming platform. The trouble with storing this data in tabular form is that to do it manually, it requires a lot of cross-referencing that your computer should be able to do for you. So, lets conjure up some normalized data to illustrate my point:
| Title | Year |
|---|---|
| Final Fantasy XII | 2006 |
| Super Mario 64 | 1996 |
This table, lets call it table “A”, has two games and their original release year. You could say that this table is the “original release year for a game”. Now, lets say we also have this table:
| Title | Platform |
|---|---|
| Final Fantasy XII | PS2 |
| Final Fantasy XII | PS4 |
| Final Fantasy XII | Xbox One |
| Final Fantasy XII | Switch |
| Final Fantasy XII | PC |
| Super Mario 64 | N64 |
| Super Mario 64 | Wii (Virtual Console) |
| Super Mario 64 | Wii U (Virtual Console) |
| Super Mario 64 | Switch |
This table, table “B”, contains the platforms that a game is released for. The reason these are two separate tables is because the data in each table scales differently per-type. Every game only has one “initial release year”, but not every game has the same number of platforms.
I would like to query this data and find out, for each game, how many releases of it I own, and the initial year it came out. In SQL, you would write a query something like this:
SELECT A.Title AS Title, A.Year AS Year, SUM(*) AS Count
FROM A
LEFT JOIN B ON A.Title == B.Title
GROUP BY A.Title, A.Year
And it would produce the following results:
| Title | Year | Count |
|---|---|---|
| Final Fantasy XII | 2006 | 5 |
| Super Mario 64 | 1996 | 4 |
Trying to do this kind of aggregation and combining from multiple tables is simply not possible without leveraging relational data. Otherwise, you could get inconsistencies, or require complex application logic in order to ensure the data looks the way you expect. When dealing with manual data entry, with reasonably small data sets (as in, not on the order of zillions of rows, something that can fit in memory of a single machine) then relational data techniques are extremely powerful, and they allow you to turn what is otherwise a painful, error-prone process into something that your database can do for you.
When I was using spreadsheets, I kept running into this limitation all the time when using my phone to edit my tables with data on my media collection and backlog. My phone is powerful; it is 2023 after all. I should be able to, with a data set as reasonably-sized as mine, do queries with JOINs and aggregations and other sorts of expressions without needing to use a full-fledged database hosted on a server somewhere.
That is the promise of TinyDB.
When can I use TinyDB?
I am planning for beta access to start by some time in August 2023. Right now, the app is undergoing some major facelifts and does not support certain core features yet that are essential to the experience, so I am working on finishing those up getting this polished as soon as possible.
If you would like to get notified for the instant this is available, and possibly even get early beta access, you can go to tinydb.app right now and fill out the email subscription form.
What if I also want to subtract $10 from your wallet?
Luckily for you, I am running a promotion in honor of it currently being June, aka “Pride Month”. If you go to the above-mentioned email subscription form, you will see a field named “secret code” that is marked optional. If you specify “transrights” or some close-enough variation in the text box when you sign up, I will donate $10 to The Trevor Project in your honor as a way of saying thanks, and to help support trans kids. I have set a soft limit of $500 since I’m not made of money, so hurry up and add your name to the list by the end of June (or however long I want to honor the promotion for) and get it all sorted out.
Does TinyDB cost anything?
I would like all of the basic features I described of TinyDB here today to be free for all users, forever. I do not ever plan on limiting access or shoving intrusive ads into the experience. I would like to be able to offer certain features that go beyond simple database tasks in a browser, however, that might need a cost attached in order to do them sustainably. Depending on how popular this gets, I might also look into crowdfunding options for prioritizing support requests and enabling early access to features, for example. We will see.
Will it be free/open-source software?
Parts of it, yes, probably, maybe. Right now it is fully closed-source but I do intend to give parts of this an applicable license that permits free use and integrating with other software. I am still doing research into which license is best for my needs at this time.
Please share, get the word out, and I hope to start showing off new features and functionality as I develop them over the coming weeks!